Deploying reports to a large number of end-users can be a logistical headache, you need to either deploy the software to a large number of PC's in your organisation, or perhaps provide access through a Citrix system, and then you need to train end-users in the software, and manage software upgrades, etc. Fortunately, if you're working with SPF, there is a simpler way.
Wednesday, September 4, 2013
Friday, July 26, 2013
Loading Data into SPF
SPF Projects often require large volumes of legacy data to be imported, and this initial loading can account for a significant portion of the time and expense of establishing new SPF systems. With staff involved in a variety of SPF projects, we believed that the data migration process could be significantly improved using our reporting application, APS Reporter/SP. In this blog post I discuss some of the new features of APSR for generating SPF Load Files directly from source data.
Friday, March 22, 2013
SPPID PipeRuns and Recursion....what fun!
One of the things I really enjoy doing with APSR is pulling apart databases to uncover things hidden deep in the data. Most application databases provide simple reports, but when you want to do something complex is when APSR really shines.
(Warning: This post contains some advanced Queries and Scripting, sorry :-)
Recently a client found some issues with the tagging of PipeRuns in their SPPID system, and it raised questions about how many other problems were lurking in there, and how could we find them. This is a great example where APSR should be useful.
Wednesday, March 13, 2013
Instrument Data from SPI and SPPID
Various techniques are available to connect the SPI & SPPID databases (for comparison or reporting), each with it's own advantages and disadvantages.
Of course, a fully integrated SPE environment is the Rolls-Royce option. It permits intelligent, automated exchange of data in a structured environment with fine control over each step. Of course it also imposes a significant overhead, requires careful implementation, and requires an experienced developer to make any customisations.
Various other techniques are available to connect the two systems, such as using the direct SPI to SPPID tools provided in the apps, exporting reports from each system and linking them, or importing SPPID data directly into SPI.
The latest release of APS Reporter/SP (Version 4.0) introduced a new option for linking databases. Not just SPI and SPPID, but any combination of MS-SQL and Oracle databases can be linked for comparison, data extraction or reports. Potentially, data could be combined from SPI, SPEL, SPPID, SPF plus other engineering or corporate databases into a single report.
Monday, March 11, 2013
Instruments & Junction Box Connections
One of the really cool features of APS Reporter/SP is the Query Builder.
If you've worked with almost any database tools, you've seen graphical query builders. They help build SQL statements by dragging & dropping tables, creating joining, selecting fields, etc. Mostly they work much the same, with just some minor graphical changes, and usually they are great for simple queries, but have difficulty with complex queries. When it comes to writing complex queries, with sub-queries, nested unions, etc, it's back to directly coding SQL statements.
Novice users also generally have problems with Query Builders. Yes, they're graphical, and they are supposed to make it easy to create SQL statements, but they still use arcane Table & Field names, and the user still needs to understand how the database fits together. Despite being a "graphical" tool, they're still a barrier to new users getting up to speed.
For APSR, we have implemented a Query Builder that can handle almost any SQL statement, no matter how complex, all graphically. The weird field names now have clear descriptions of each field, and Virtual Tables & Fields simplify the database structure. Suddenly complex queries aren't so complex any more!
Here's a typical example. We wanted to create a simple Instrument Index Report for SPI, with the usual fields (Tag, Service, Manufacturer, Model, I/O Type, etc) plus we also wanted to include the Junction Box that the Instrument is connected to (ie where the field device is wired to). Simple enough requirement, but the Query is non-trivial.
The first step was to select all of the simple fields from the Component table in SPI:
 Fortunately, the Virtual Fields in APSR make this really easy. Almost all of the fields we want are included as Virtual Fields in the Component table, so we just need to pick them. There's no need to join to the various supporting tables (like Function Types, I/O Types, Equipment, Manufacturer, Model, etc).
The only complicated field in this Report will be the Junction Box that the field devices connect to. To identify the correct Junction Box, the Query uses a sub-query with Wire Group (signal) information to find, for each signal, the lowest signal sequence number in a Junction Box. Then a second sub-query is used to find the particular Junction Box that contains that signal sequence number.
In APSR, sub-queries are defined as "Derived Tables". Creating a Derived Table produces a new work-space for us to build our sub-query.

The first sub-query actually finds the lowest wire GROUP_SEQ number for each WIRE_GROUP_ID, for wires that are connected to Junction Boxes (CATEGORY_SEQ = 6).
 Then, we use the another Derived Table to use the minimum GROUP_SEQ from above to identify the correct Panel (Junction Box).
 Our first Derived Table appears in the middle, with only the two selected fields showing. This second Derived Table has two outputs, the CMPNT_ID to identify the field device, and the Panel Name (which conveniently uses another Virtual Field to simplify our query). This Derived Table appears in our Main query, where we join to the Component table, and select the Panel name (using an Outer Join, as not all Instruments are connected to Junction Boxes).
 Switching to the Query Results, we get:
 The final SQL Query Statement is shown below, although fortunately we don't ever need to actually work with this. You could copy-and-paste it into your own APSR system, although the full report is included as a Sample Report in the installation package. (Note that this Query will not work in other tools as it uses APSR Virtual Fields that are not supported by other applications)
Select
COMPONENT.CMPNT_NAME,
COMPONENT.CMPNT_SERV,
COMPONENT.CMPNT_FUNC_TYPE_DESC,
COMPONENT.CMPNT_FUNC_TYPE_NAME,
COMPONENT.PLANT_NAME,
COMPONENT.AREA_NAME,
COMPONENT.UNIT_NAME,
COMPONENT.LOOP_NAME,
COMPONENT.CMPNT_MOD_NAME,
COMPONENT.CMPNT_MFR_NAME,
JUNCTION_BOX.PANEL_NAME As FIRST_JB,
COMPONENT.LOOP_DWG_NAME,
COMPONENT.PID_DWG_NAME
From
COMPONENT
Left Join
(Select WIRE_GROUP.CMPNT_ID,
WIRE_TERMINAL.PANEL_NAME
From WIRE_GROUP
Inner Join WIRE_TERMINAL On WIRE_GROUP.WIRE_GROUP_ID = WIRE_TERMINAL.WIRE_GROUP_ID
Inner Join (Select Min(WIRE_TERMINAL.GROUP_SEQ) As MIN_GROUP_SEQ,
WIRE_TERMINAL.WIRE_GROUP_ID
From WIRE_TERMINAL
Inner Join PANEL On WIRE_TERMINAL.PANEL_ID = PANEL.PANEL_ID
Group By WIRE_TERMINAL.WIRE_GROUP_ID,
PANEL.PANEL_CATEGORY_SEQ
Having PANEL.PANEL_CATEGORY_SEQ = 6) FIRST_JB_CONNECT
On WIRE_GROUP.WIRE_GROUP_ID = FIRST_JB_CONNECT.WIRE_GROUP_ID
And WIRE_TERMINAL.GROUP_SEQ = FIRST_JB_CONNECT.MIN_GROUP_SEQ
Where WIRE_TERMINAL.WIRE_GRP_LEVEL = 1) JUNCTION_BOX
On COMPONENT.CMPNT_ID = JUNCTION_BOX.CMPNT_ID
Where
COMPONENT.CMPNT_ID <> 0 And
COMPONENT.PLANT_ID <> 0
Order By
COMPONENT.LOOP_NAME,
COMPONENT.CMPNT_NAME
Sub-queries are an incredibly powerful tool for expanding your Reports, and with the APSR Query Builder creating Sub-queries (or Derived Tables) is as simple as almost any other query.
If you'd like to see some other sample queries and reports for SPI, check the relevant Wiki page. More information is also available from the various links to the right.
If you have any queries (pun?) or comments, feel free to add them below.
Regards,

If you've worked with almost any database tools, you've seen graphical query builders. They help build SQL statements by dragging & dropping tables, creating joining, selecting fields, etc. Mostly they work much the same, with just some minor graphical changes, and usually they are great for simple queries, but have difficulty with complex queries. When it comes to writing complex queries, with sub-queries, nested unions, etc, it's back to directly coding SQL statements.
Novice users also generally have problems with Query Builders. Yes, they're graphical, and they are supposed to make it easy to create SQL statements, but they still use arcane Table & Field names, and the user still needs to understand how the database fits together. Despite being a "graphical" tool, they're still a barrier to new users getting up to speed.
For APSR, we have implemented a Query Builder that can handle almost any SQL statement, no matter how complex, all graphically. The weird field names now have clear descriptions of each field, and Virtual Tables & Fields simplify the database structure. Suddenly complex queries aren't so complex any more!
Here's a typical example. We wanted to create a simple Instrument Index Report for SPI, with the usual fields (Tag, Service, Manufacturer, Model, I/O Type, etc) plus we also wanted to include the Junction Box that the Instrument is connected to (ie where the field device is wired to). Simple enough requirement, but the Query is non-trivial.
The first step was to select all of the simple fields from the Component table in SPI:
The only complicated field in this Report will be the Junction Box that the field devices connect to. To identify the correct Junction Box, the Query uses a sub-query with Wire Group (signal) information to find, for each signal, the lowest signal sequence number in a Junction Box. Then a second sub-query is used to find the particular Junction Box that contains that signal sequence number.
In APSR, sub-queries are defined as "Derived Tables". Creating a Derived Table produces a new work-space for us to build our sub-query.
The first sub-query actually finds the lowest wire GROUP_SEQ number for each WIRE_GROUP_ID, for wires that are connected to Junction Boxes (CATEGORY_SEQ = 6).
Select
COMPONENT.CMPNT_NAME,
COMPONENT.CMPNT_SERV,
COMPONENT.CMPNT_FUNC_TYPE_DESC,
COMPONENT.CMPNT_FUNC_TYPE_NAME,
COMPONENT.PLANT_NAME,
COMPONENT.AREA_NAME,
COMPONENT.UNIT_NAME,
COMPONENT.LOOP_NAME,
COMPONENT.CMPNT_MOD_NAME,
COMPONENT.CMPNT_MFR_NAME,
JUNCTION_BOX.PANEL_NAME As FIRST_JB,
COMPONENT.LOOP_DWG_NAME,
COMPONENT.PID_DWG_NAME
From
COMPONENT
Left Join
(Select WIRE_GROUP.CMPNT_ID,
WIRE_TERMINAL.PANEL_NAME
From WIRE_GROUP
Inner Join WIRE_TERMINAL On WIRE_GROUP.WIRE_GROUP_ID = WIRE_TERMINAL.WIRE_GROUP_ID
Inner Join (Select Min(WIRE_TERMINAL.GROUP_SEQ) As MIN_GROUP_SEQ,
WIRE_TERMINAL.WIRE_GROUP_ID
From WIRE_TERMINAL
Inner Join PANEL On WIRE_TERMINAL.PANEL_ID = PANEL.PANEL_ID
Group By WIRE_TERMINAL.WIRE_GROUP_ID,
PANEL.PANEL_CATEGORY_SEQ
Having PANEL.PANEL_CATEGORY_SEQ = 6) FIRST_JB_CONNECT
On WIRE_GROUP.WIRE_GROUP_ID = FIRST_JB_CONNECT.WIRE_GROUP_ID
And WIRE_TERMINAL.GROUP_SEQ = FIRST_JB_CONNECT.MIN_GROUP_SEQ
Where WIRE_TERMINAL.WIRE_GRP_LEVEL = 1) JUNCTION_BOX
On COMPONENT.CMPNT_ID = JUNCTION_BOX.CMPNT_ID
Where
COMPONENT.CMPNT_ID <> 0 And
COMPONENT.PLANT_ID <> 0
Order By
COMPONENT.LOOP_NAME,
COMPONENT.CMPNT_NAME
Sub-queries are an incredibly powerful tool for expanding your Reports, and with the APSR Query Builder creating Sub-queries (or Derived Tables) is as simple as almost any other query.
If you'd like to see some other sample queries and reports for SPI, check the relevant Wiki page. More information is also available from the various links to the right.
If you have any queries (pun?) or comments, feel free to add them below.
Regards,
Brian Raynor.
Wednesday, March 6, 2013
Graphs & Stats from the SPF Database
In this final post of three covering Virtualisation in SPF (the others are here and here) I'm going to look at producing simple statistical reports from SPF databases using straight-forward SQL Statements.
As discussed in the previous posts, using a Virtual Model of the SPF database we're able to produce reports directly from the source database without complex coding. The model appears as a straight-forward relational database, with Virtual Tables representing the various Classes, Interfaces and Relationships of SPF. The SQL language is a powerful tool for manipulating relational databases and modelling complex systems as simple relational systems allows us to leverage the power of SQL, while ignoring much of the underlying complexity of the source database.
By way of example, I'm going to produce some reports on Transmittals in SPF. The Queries are deliberately simple, but they could easily be extended to cover a range of requirements. If you would like full step-by-step guidelines to build these reports, refer to the Wiki.
Starting with a simply Query, just the ISPFTransmittal Table. This is a Virtual Table for the corresponding InterfaceDef, and provides a list of all Transmittals in the system.
The Query is simply generating a list of Transmittal Issue Dates (Years & Months), and then counting the Transmittals in each month. This gives us a simple list:

A simple list of results is fine, but a graph will make a much better report. Switching to the Report Designer, we can add a simple a simple Chart to our report.


This gives us:


As discussed in the previous posts, using a Virtual Model of the SPF database we're able to produce reports directly from the source database without complex coding. The model appears as a straight-forward relational database, with Virtual Tables representing the various Classes, Interfaces and Relationships of SPF. The SQL language is a powerful tool for manipulating relational databases and modelling complex systems as simple relational systems allows us to leverage the power of SQL, while ignoring much of the underlying complexity of the source database.
By way of example, I'm going to produce some reports on Transmittals in SPF. The Queries are deliberately simple, but they could easily be extended to cover a range of requirements. If you would like full step-by-step guidelines to build these reports, refer to the Wiki.
Starting with a simply Query, just the ISPFTransmittal Table. This is a Virtual Table for the corresponding InterfaceDef, and provides a list of all Transmittals in the system.
| ISPFTransmittal Table |
 |
| Chart Wizard (click to enlarge) |
This gives us a nice visual indication of the spike in Transmittals issued in November & December.
But how many documents were actually issued? In November, were there 120 documents, or 1200 documents?
By adding the relationship between Transmittals and Document Versions to the original query it will now count Documents issued rather than Transmittals. (Wiki)
An extreme peak in November still, almost 1000 documents issued via Transmittals. Does that mean that there were a lot of Transmittals with around 10 documents each, or perhaps there were one or two that accounted for the bulk of the documents? (Wiki)
Going back to the original Query, we can wrap the SQL statement in another clause, and this time count the number of Transmittals based on the size of each (number of Documents), using the CASE statement:
This will assign each Transmittal into one of 5 Categories.
Just a few simple Queries lets us extract useful data, without custom programming or specialised skills. This is the power of the Schema Virtualisation in APS Reporter/SP, it lets us work with our data without regard to the complex structures of the native databases.
There is a complete walk-through of the Queries and Charts above on the Wiki site.
If you have any questions or comments, please feel free to leave them below, or contact me at one of the links to the right.
Regards,
Brian.
Saturday, March 2, 2013
SPF as a Source of Data
I'll apologise in advance, this is going to turn into a long post with lots of text and some obscure concepts, but I promise it will be worthwhile. I'm already planning for this to be the first in a trilogy covering APSR and the SPF database (sort of an APSR: A New Hope), with this one setting the stage and the next couple diving deeper into the technical stuff. If after reading this you have any comments or would like any further information, please feel free to use the comment box below, or contact me through one of links to the right.
Most databases are highly normalised and are optimised for performance. This usually means they have many tables, in a highly structured form, where each table has a unique key (id) field. This allows the database engine (Oracle or MS-SQL Server) to find the most efficient way to retrieve data when requested by the application.
Unfortunately, the trade-off for us is that a highly normalised and optimised database is usually more complex to produce reports. The required data fields are spread across a lot of tables, and the designer needs to understand how they're all related.
SPF Is Different
Then there are databases like SPF. If you've ever looked at the SPF database, at first glance it doesn't seem too complicated as there are just a handful of tables, however the complexity of the SPF database lies not in the number or structure of the tables but in how the data is stored in the tables. A single application Object is not stored as a row in a table, but is spread across many rows and often many tables. This design is not optimised for performance, instead it is designed for flexibility, allowing the SPF Developer to add new Classes, Interfaces and Relations without modifying the underlying database structure. This allows SPF to support a catalog of 2000+ Classes, with 70,000+ Properties, with less than 20 database tables.For the Report Designer, however, this structure is a major problem. Extracting meaningful reports directly from the SPF Database is incredibly difficult, and those who have tried do not always succeed. Just working out how the data is stored is a challenge, but then creating SQL Queries to piece together all of the required data requires specialist skills. It is possible to manually write queries that provide simple lists of data, such as a document list, or a tag list, but creating queries that join the data together in meaningful ways is almost impossible.
For example, if you were working with a conventional relational database, and you wanted to get a list of documents that were associated with transmittals that are overdue, it typically wouldn't be very complex (probably two or three major tables, plus some supporting tables). A similar Query from the SPF database would be enormously complex, and even if it worked, just validating the query would be difficult (how many people could even understand it!).
This is one of the trade-off's made by the Intergraph developers in implementing SPF, it would be flexible, but working with the database would be complex. SPF users cannot use conventional database tools, like Toad or Crystal Reports, to extract data or create reports, they are almost cut-off from their data and must use the SPF software itself for all queries and reports. Standard SQL queries became impractical.
Simplifying Databases
APS Reporter/SP was designed to simplify the creating of Reports, by making it easier to extract the data (query), easy to produce either simple tabular reports, or complexly formatted reports, and easier to keep revisions, add title blocks, etc.The Queries are simplified by using a technique known as Schema Virtualisation, which uses a Model of the database that is optimised for Reports. The user doesn't work directly with the underlying database, they work with a Virtual Model that appears to be a standard relational database with Tables and Fields that are easy to understand (but not necessarily optimised for the database server).
The first Virtualiser we developed was for SmartPlant Instrumentation. SPI has a database that is relatively large (300+ tables), but is not overly complex. It's not a very difficult database to use for reports, but often even a simple report (such as an Instrument Index) can require 10 or more tables, and complex queries could include many more. Using the SPI Virtual Model the same query can include just 1 table, and complex queries often just 3 or 4.
 |
| SPI Queries using the native database, and the Virtual Model |
But what about SPF?
SPF was challenging. Could we produce a Virtual Model that made it easy to create queries, with no knowledge of the SPF database structure?Initially, we tackled SPF 3.8 (Business Objects), and it worked beautifully. Users could build SQL Queries, working with the various Business Objects, while completely ignoring the cryptic table names and field names of the native database.
The real challenge was SPF 4.x. The Virtual Model had to fully support the ClassDef's, InterfaceDef's and RelDef's of the Schema model, allowing Report Designers to write Queries using the Objects they were familiar with. It also had to adapt to each client's database, including all of the custom schema objects defined in each system, and for the custom objects to work seamlessly with the out-of-the-box objects.
 |
| SPF Query with DocMaster & DocRevision |
It's now possible to write quick and easy adhoc SQL queries for the SPF database using standard SQL syntax. Complex queries can be written without any specialist knowledge of the SPF database structure, and Reports can be produced in a fraction of the time usually required.
In the next post I'll look at the process of writing queries for SPF with some tips and tricks to make life even easier.
If you have any comments, please feel free to use the comment box below. If you would like any further information, a free trial license, or a demonstration of APS Reporter/SP, please feel free to use the links to the right.
Tuesday, February 19, 2013
Virtualisation for SPI & SPF
In the previous post I discussed the effect that database structure has on reporting, explaining how normalisation and optimisation often results in a more complex database, making it more difficult to extract the required data. Today I'm going to look more deeply at the SPI and SPF databases and how we can simplify reporting using the Schema Virtualisation technology in APS Reporter/SP.
Most applications recognise that users will want to produce reports in a wide variety of formats, with different combinations of data, and they will usually provide a rudimentary reporting system. In the good ol' days, databases were generally simple and if the application didn't provide the reports you needed it was easy enough to grab your copy of MS-Access or Crystal Reports and produce your own reports, perhaps after an hour or two to get your mind around the database.
The ubiquitous Query Builder window, found in almost all database management applications (except perhaps those favoured by certain Oracle command-line die-hards), was the standard tool for extracting data. The Query Builder, and the SQL statements produced, were effectively standardised and once you'd learnt how to produce a Query for one database, moving to another database was straight-forward and even switching applications and database platforms (eg Oracle to MS-SQL) was not usually a problem.
Progressively, as databases evolved and become more complex, options for extracting data and producing reports became more limited. External tools that had been useful became more difficult to use, users required a deeper understanding of the applications databases, and had to rely entirely on the tools provided by the application. Specialists with expert-level skills and knowledge of the arcane secrets of each database were required.
Schema Virtualisation technology presents the user with a view of the database that appears to be a standard relational database "de-normalised". Rather than a design optimised for performance, it is optimised for reporting. Fields appear in tables where the user would intuitively expect to find them, or where they would be most convenient, and tables are arranged to represent items the user is familiar with, rather than the software developer.
For example, for an Instrument Index in SPI, users would require:
Warning! SQL Statements Ahead....Proceed at your own risk!
Most applications recognise that users will want to produce reports in a wide variety of formats, with different combinations of data, and they will usually provide a rudimentary reporting system. In the good ol' days, databases were generally simple and if the application didn't provide the reports you needed it was easy enough to grab your copy of MS-Access or Crystal Reports and produce your own reports, perhaps after an hour or two to get your mind around the database.
The ubiquitous Query Builder window, found in almost all database management applications (except perhaps those favoured by certain Oracle command-line die-hards), was the standard tool for extracting data. The Query Builder, and the SQL statements produced, were effectively standardised and once you'd learnt how to produce a Query for one database, moving to another database was straight-forward and even switching applications and database platforms (eg Oracle to MS-SQL) was not usually a problem.
Progressively, as databases evolved and become more complex, options for extracting data and producing reports became more limited. External tools that had been useful became more difficult to use, users required a deeper understanding of the applications databases, and had to rely entirely on the tools provided by the application. Specialists with expert-level skills and knowledge of the arcane secrets of each database were required.
Ironically, as more and more data is stored in databases, the data became effectively hidden behind behind a wall of it's own complexity.With APS Reporter/SP we wanted to open up these databases again. SQL, and the Query Builder, are still the best way to manipulate large data sets, whether you're extracting data for reports or exporting. The challenge was to hide the complexity of each database from the user, while still allowing them to work with the traditional Query Builder window and SQL.
Schema Virtualisation technology presents the user with a view of the database that appears to be a standard relational database "de-normalised". Rather than a design optimised for performance, it is optimised for reporting. Fields appear in tables where the user would intuitively expect to find them, or where they would be most convenient, and tables are arranged to represent items the user is familiar with, rather than the software developer.
|
| SPI Instrument Index Query simplified with Virtualisation |
Instrument Tag, Service Description, Instrument Type, Status, I/O Type, Manufacturer, Model, Location, Certification, Loop Name, P&IDThese are all logically related to the Instrument, but are actually stored in 10 separate tables in SPI (for excellent integrity & performance reasons). To produce a simple report requires a Query as shown on the left above, or in the SQL statement below:
Select
COMPONENT.CMPNT_NAME,
COMPONENT.CMPNT_SERV,
COMPONENT_FUNCTION_TYPE.CMPNT_FUNC_TYPE_NAME,
COMPONENT_FUNCTION_TYPE.CMPNT_FUNC_TYPE_DESC,
COMPONENT_HANDLE.CMPNT_HANDLE_NAME,
COMPONENT_SYS_IO_TYPE.CMPNT_SYS_IO_TYPE_NAME,
COMPONENT_MFR.CMPNT_MFR_NAME,
COMPONENT_MOD.CMPNT_MOD_NAME,
COMPONENT_LOCATION.CMPNT_LOC_NAME,
COMPONENT_CERTIFICATION.CMPNT_CERTIF_NAME,
LOOP.LOOP_NAME,
DRAWING.DWG_NAME
From
COMPONENT
Inner Join COMPONENT_FUNCTION_TYPE
On COMPONENT.CMPNT_FUNC_TYPE_ID = COMPONENT_FUNCTION_TYPE.CMPNT_FUNC_TYPE_ID
Inner Join COMPONENT_MFR
On COMPONENT.CMPNT_MFR_ID = COMPONENT_MFR.CMPNT_MFR_ID
Inner Join COMPONENT_MOD
On COMPONENT.CMPNT_MOD_ID = COMPONENT_MOD.CMPNT_MOD_ID
Inner Join COMPONENT_SYS_IO_TYPE
On COMPONENT.CMPNT_SYS_IO_TYPE_ID = COMPONENT_SYS_IO_TYPE.CMPNT_SYS_IO_TYPE_ID
Inner Join COMPONENT_LOCATION
On COMPONENT.CMPNT_LOC_ID = COMPONENT_LOCATION.CMPNT_LOC_ID
Inner Join COMPONENT_HANDLE
On COMPONENT.CMPNT_HANDLE_ID = COMPONENT_HANDLE.CMPNT_HANDLE_ID
Inner Join COMPONENT_CERTIFICATION
On COMPONENT.CMPNT_CERTIF_ID = COMPONENT_CERTIFICATION.CMPNT_CERTIF_ID
Inner Join LOOP
On COMPONENT.LOOP_ID = LOOP.LOOP_ID
Inner Join DRAWING
On COMPONENT.DWG_ID = DRAWING.DWG_ID
The red text indicates the links between the primary COMPONENT table of SPI (containing the master list of Instruments) and the various related tables. Schema Virtualisation removes this complexity, users can treat the various related fields like there are actually part of the primary table and leave APS Reporter/SP to work out how to relate the additional tables. The result is the Query shown on the right above, and in the image below:
APS Reporter/SP also provides meaningful names for the fields, rather than the cryptic database field names selected by the developer. The resulting SQL Statement is also much simpler:
 |
| Virtualised Component Table |
Select
COMPONENT.CMPNT_NAME,
COMPONENT.CMPNT_SERV,
COMPONENT.CMPNT_FUNC_TYPE_NAME,
COMPONENT.CMPNT_SYS_IO_TYPE_NAME,
COMPONENT.CMPNT_LOC_NAME,
COMPONENT.CMPNT_MFR_NAME,
COMPONENT.CMPNT_MOD_NAME,
COMPONENT.LOOP_NAME,
COMPONENT.LOOP_DWG_NAME,
COMPONENT.CMPNT_FUNC_TYPE_DESC,
COMPONENT.PID_DWG_NAME
From
COMPONENT
(Note of course that this SQL Statement could not be used in any other application, it would not know how to resolve the various field names into their respective tables)
For SPI, the improvement is dramatic, but for SPF it is simply amazing.
The SPF database does not contain tables that most users could recognise. For example, if you're looking for a list of documents, there is no Document table. In fact, there is no table representing any particular object type, and writing a query to extract even a simple list is incredibly complex (so much so, I don't even have an example to show you...perhaps someone could volunteer one?).
On the other hand, the Schema Virtualisation in APS Reporter/SP lets us work with the SPF database just like it was a conventional relational database! We can ignore the underlying complexity, and just select what we need:
In this case we're working the the SPFDesignDocMaster Class in SPF, Virtualised as a Table. The SQL Statement is as follows:
With the Virtualised Schema available, the full power of SQL can be used. Sophisticated Queries can manipulate the data in creative ways to extract just the information needed. For example, in SPI, producing an Instrument Index which includes the I/O data for each tag, or the corresponding Junction Box & Marshalling terminals, becomes simple.
Another example, an SPF client had a problem. Their old Document Control system had a huge number of scanned hard-copy documents in TIF format, and when they were migrated to SPF a copy of the scanned document in PDF format was to be added to each document. After a short time they discovered that a few of the documents were missing the PDF file, but they had no idea just how many. Somehow they had to identify just how many documents were affected (how big was the problem), and get a list of the documents they had to fix. Extracting such a report from SPF would typically require some specialist skills and possibly some custom software, but a straight-forward SQL Statement answered the question in a few minutes (a few hundred documents).
This is the key to a good reporting tool, and it should be expected from any database tool. Providing quick and easy access to the data for the routine reports required regularly, plus also the one-off adhoc queries that come up from time to time.
You're not getting full value from your data while it is hidden inside a complex database that prevents access. Having the full power of SQL available, while avoiding the complexity of the underlying database, allowing you to access your data anyway you wish, is the key.
In this post I've had a deeper look at some specific examples of working with the SPI & SPF databases, and highlighted the advantages of working with Schema Virtualisation. Next time I'm going to have a look at some of the clever things that can be done with a good reporting engine, including exception reporting to identify errors in data, and some statistical reporting for analysis and KPI's.
For SPI, the improvement is dramatic, but for SPF it is simply amazing.
The SPF database does not contain tables that most users could recognise. For example, if you're looking for a list of documents, there is no Document table. In fact, there is no table representing any particular object type, and writing a query to extract even a simple list is incredibly complex (so much so, I don't even have an example to show you...perhaps someone could volunteer one?).
On the other hand, the Schema Virtualisation in APS Reporter/SP lets us work with the SPF database just like it was a conventional relational database! We can ignore the underlying complexity, and just select what we need:
 |
| SPFDesignDocMaster Vitualised Table |
SelectAgain, the Query Builder provides us with clear descriptions for each field, and handles the translation to SQL.
SPFDesignDocMaster.SPFDesignDocMaster_Name,
SPFDesignDocMaster.Description,
SPFDesignDocMaster.SPFDocCategory_Desc,
SPFDesignDocMaster.SPFDocState,
SPFDesignDocMaster.SPFTitle,
SPFDesignDocMaster.SPFDocType
From
SPFDesignDocMaster
With the Virtualised Schema available, the full power of SQL can be used. Sophisticated Queries can manipulate the data in creative ways to extract just the information needed. For example, in SPI, producing an Instrument Index which includes the I/O data for each tag, or the corresponding Junction Box & Marshalling terminals, becomes simple.
Another example, an SPF client had a problem. Their old Document Control system had a huge number of scanned hard-copy documents in TIF format, and when they were migrated to SPF a copy of the scanned document in PDF format was to be added to each document. After a short time they discovered that a few of the documents were missing the PDF file, but they had no idea just how many. Somehow they had to identify just how many documents were affected (how big was the problem), and get a list of the documents they had to fix. Extracting such a report from SPF would typically require some specialist skills and possibly some custom software, but a straight-forward SQL Statement answered the question in a few minutes (a few hundred documents).
This is the key to a good reporting tool, and it should be expected from any database tool. Providing quick and easy access to the data for the routine reports required regularly, plus also the one-off adhoc queries that come up from time to time.
You're not getting full value from your data while it is hidden inside a complex database that prevents access. Having the full power of SQL available, while avoiding the complexity of the underlying database, allowing you to access your data anyway you wish, is the key.
In this post I've had a deeper look at some specific examples of working with the SPI & SPF databases, and highlighted the advantages of working with Schema Virtualisation. Next time I'm going to have a look at some of the clever things that can be done with a good reporting engine, including exception reporting to identify errors in data, and some statistical reporting for analysis and KPI's.
Regards,
Brian.
Thursday, February 14, 2013
Cable Schedules
This is a brief post covering a feature of APSR that was introduced in Version 3.0 but is not often used, despite it being a really powerful tool for controlling page layouts in the Report Designer.
Sub-reports are one of those features that will either make your eyes light up, or will draw a blank "Huh?". They're great when you need to design a complex report, and there are some designs that just can't be done without sub-reports, but if you've never needed them, then you've probably never even tried them.
For the experienced Report Designer, Sub-reports provide the ultimate in fine-grained control over your report layout, and in APSR we have perhaps the easiest sub-reports of any reporting application. When the report designer is open, all report sections and sub-reports are shown as tabs across the top of the window, and switching between the Parent report and the Child (sub) report is as easy as switching tabs.
The new report "Cable Schedule with Routing Sub-report" is a great example.
Each Report Section can be either a full-page Section that prints on separate pages in the final report, or a Sub-Report Section that printed embedded in another page. This report contains six separate sections, the first three of which are separate printable sections which appear full-page, and the last three are sub-reports which appear embedded on the Cable Schedule page.
Each Report Section has a Sequence Number that determines the order in which they appear in the final Report (a value of zero (0) indicates it's a sub-report only). For example, the Summary Page is a simple list of the Cable Types included in the main Cable Schedule, with the total length of each Type shown. This is the second section to print, as set in the Properties box.
The main section of the report (Cable Schedule) includes two sub-reports, one for the Cable Route information, and another as a Title Block. Cable Routes show the various Cable Ladder sections or Nodes that the Cable passes through, and there can be anywhere from zero (0) to dozens of Cable Route items for each Cable. We want them to appear in a compact area of the detail section of each Cable, in the Routing column.
Finally, the Filter String is used to link the Parent and Child Reports. In this case, it filters the sub-report (with the route data) to only show route information for the Cable currently appearing in the Parent report.
Sub-reports are one of those features that will either make your eyes light up, or will draw a blank "Huh?". They're great when you need to design a complex report, and there are some designs that just can't be done without sub-reports, but if you've never needed them, then you've probably never even tried them.
For the experienced Report Designer, Sub-reports provide the ultimate in fine-grained control over your report layout, and in APSR we have perhaps the easiest sub-reports of any reporting application. When the report designer is open, all report sections and sub-reports are shown as tabs across the top of the window, and switching between the Parent report and the Child (sub) report is as easy as switching tabs.
The new report "Cable Schedule with Routing Sub-report" is a great example.
 |
| Cable Schedule with Routing Sub-report |
Each Report Section has a Sequence Number that determines the order in which they appear in the final Report (a value of zero (0) indicates it's a sub-report only). For example, the Summary Page is a simple list of the Cable Types included in the main Cable Schedule, with the total length of each Type shown. This is the second section to print, as set in the Properties box.
 |
| Section Display Name and Sequence Number (print order) |
 |
| Routing Sub-report Section embedded in the Parent Report Section |
 |
| Filter String linking the Parent & Child Report Sections |
The Title Block sub-report appears in the Page Footer of the main Cable Schedule, and in-turn contains another sub-report for Revisions (ie nested sub-reports!)
You can check-out the full report by downloading a trial package. We have also included an SPI Wiring Report "Terminal Strip with Wiring Connections" which shows the wire connections on each side of a Terminal Strip. For each terminal, a sub-report is used on the Left and Right hand sides which nicely handles situations were 2 or more wires are connected to the same terminals.
Saturday, February 2, 2013
Alarm & Trip Schedules
This week I was working on an Alarm & Trip Schedule for a client (hi Terri) and it occurred to me that this is a report that is required by almost every project, but is always a little complicated to produce.
Projects often require an Alarm & Trip Schedule to be produced from SPI, and it's often a frustrating process to extract the required data. The required fields appear in the Instrument Index module, the Process Data module, and the Wiring module, and no Browser conveniently combines everything into a single View. In fact, as a general rule, SPI doesn't provide many Browsers that mix data between modules.


Projects often require an Alarm & Trip Schedule to be produced from SPI, and it's often a frustrating process to extract the required data. The required fields appear in the Instrument Index module, the Process Data module, and the Wiring module, and no Browser conveniently combines everything into a single View. In fact, as a general rule, SPI doesn't provide many Browsers that mix data between modules.
Fortunately, it's actually quite simple to create an Alarm & Trip Schedule with APSR. The Query is relatively easy, making use of Virtual Fields and a nested Union, and of course the Grid or Designer make it simple to produce a deliverable report.
Typically an Alarm & Trip Schedule is a list of Instruments (usually Analog Inputs) with some basic tag data, the range of the device and/or DCS/PLC input, the Alarm & Trip Set-points (as defined by the Process Engineers usually) and the Set-points configured in the DCS/PLC. There may be other information, such as the I/O Card details, the Control System Tag & Description, etc.
Typically an Alarm & Trip Schedule is a list of Instruments (usually Analog Inputs) with some basic tag data, the range of the device and/or DCS/PLC input, the Alarm & Trip Set-points (as defined by the Process Engineers usually) and the Set-points configured in the DCS/PLC. There may be other information, such as the I/O Card details, the Control System Tag & Description, etc.
The primary fields are found in the COMPONENT table, from which we select the core Instrument fields (Tag, Service, I/O Type) plus some range fields if required (Instrument Range, Calibrated Range and/or DCS Range).


Unfortunately, the Alarm & Trip Set-points are not in the Instrument Index, they're in the SPI Process Data module (a design decision that has caused a lot of frustration for many many projects). This creates two problems, one that the Alarm & Trip Set-points cannot be included in any Browsers in the Instrument Index module, and that it is necessary to create a Process Data entry for an Instrument before the Set-points can be entered.
Often, to avoid these problems, projects will choose to use UDF's for alarms. This is a very practical solution, although it can cause confusion on projects where both the UDF's and the Process Data fields are used.
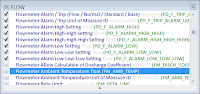
The Process Data module has another complication, the Alarms & Trip Set-points are not stored in a single table, they're in the FLOW, LEVEL_INSTRUMENT , PRESSURE, and TEMPERATURE tables (depending on the Process Function Type of the Instrument). We need to use a UNION to combine the results from each of these tables in APSR, first by creating a Derived Table (sub-query) to hold the Union

In the Derived Table tab, we start with the FLOW table, and select the various Alarm & Trip Set-points and related fields:


Then create the Union by clicking the + next to the Q in the upper right corner of the window, this will open a new blank query pane for the next part of the Union. Add the LEVEL_INSTRUMENT table and select the corresponding fields here:


Repeat the process by adding new Union sections, adding the PRESSURE and TEMPERATURE tables, and selecting the corresponding fields. When we return to the Main tab, we now have a sub-query providing the combined Alarm & Trip Set-points from all of the Process Data tables:

(Note that the field descriptions are based on the first table in the Union)
The other place Alarm data is entered in SPI is as part of the Control System Tags associated with Instruments. By adding the CONTROL_SYSTEM_TAG table to our query we can extract the Control System Tag Name, Description, Calibration Range, Alarm Settings, plus other DCS and Wiring data as required.
In the end it's a relatively simple query.
The results are shown below (click to enlarge).
I've used the APSR Grid to display the results. This makes it very easy to layout a simple report of rows & columns, and also is ideal if you need to export the final report to Excel. You could also use the Report Designer if you need a pixel-perfect fully formatted report.
You can download
- Alarm & Trip Schedule Report for APSR (you will need APSR installed),
- Exported Excel report.
That's the basic report, but of course it can be modified to the requirements of any particular project. Also, the Grid Layout I've developed is designed for exporting to Excel and issuing as a document, but if a data extract is required for export to the DCS programmers (for example), that is just as easy.
Let me know your thoughts. Do you have any specific requirements for an Alarm & Trip Schedule?
Regards,
Brian.
Wednesday, January 30, 2013
Simple Instrument Index Query
When we sat down to build our own reporting tool for engineering databases, we really wanted the best of all possible worlds (doesn't everyone!). We wanted something that was easy to use, that novices could learn without trouble, but something that experienced users wouldn't feel constrained by. The ease of use should work with the user, making complex tasks simple, not dumb it down to the point where it couldn't do anything but the most basic task.
The Query Builder was perhaps the most challenging part of the application. Typically, Query Builders are confusing for new users, they can be daunting and often new users will be discouraged as soon as the Query Builder window opens. They have lots of tables floating around the window, with connections between them, strange symbols, and cryptic field names. For Expert users though, Query Builders are great, they open up so many options that would otherwise be unavailable, and we had to maintain that.
 When it came to the Query Builder for APSR, should we go with the traditional approach, or should we try something different. Almost everything "different" we've ever seen has meant "basic", where the user has a limited range of options, sometimes in some overly graphical window with lots of pretty pictures. Graphics are great, but they shouldn't actually confuse the user, and they shouldn't come at the expense of power!
We elected to stick with a fairly traditional Query Builder window, but we introduced a powerful new system of Virtualisation that simplifies the structure of Queries. This means that many queries can now be built with just a single table, or perhaps two, while the system automatically filled-in the missing information. We also added meaningful descriptions to field names, so rather than just seeing CMPNT_SYS_IO_TYPE_NAME, the user also sees "Instrument I/O Type".
The Result?
If you're an SPI user, you'll find building a Query is not very different to defining a Browser View. Simply select the fields you want, and the system does the rest. This one table is all that's needed for a simple Instrument Index report.
Of course, if you'd like to add some more tables, that's fine too, it's still a fully functional Query Builder. For example, if we wanted to include some fields from the Component Function Type table, then we just add it to the Query and join in the traditional way.
 Here we've added the second table, and then used Virtual Fields to provide the default Cable Name, Panel Name and Specification Sheet Number for each Instrument Type. (Click the image to enlarge).
For the SQL-geeks, this produces the following (for the non-geeks, you can ignore this bit, it doesn't really matter!):
Select
COMPONENT.CMPNT_NAME,
COMPONENT.CMPNT_FUNC_TYPE_NAME,
COMPONENT.CMPNT_SYS_IO_TYPE_NAME,
COMPONENT.CMPNT_LOC_NAME,
COMPONENT.CMPNT_MFR_NAME,
COMPONENT.CMPNT_MOD_NAME,
COMPONENT.CMPNT_SERV,
COMPONENT_FUNCTION_TYPE.CABLE_NUM,
COMPONENT_FUNCTION_TYPE.PANEL_NAME,
COMPONENT_FUNCTION_TYPE.SPEC_FORM_CNUM
From
COMPONENT
Inner Join
COMPONENT_FUNCTION_TYPE
On COMPONENT.CMPNT_FUNC_TYPE_ID = COMPONENT_FUNCTION_TYPE.CMPNT_FUNC_TYPE_ID
A simple SQL statement, which you could hand-edit if you chose to. Of course, this SQL statement wouldn't work in any other application (the Virtual Fields would cause errors), but APSR correctly interprets it and translates it into the SQL statement required by the database server. There are actually nine (9) different tables in the query above, seven (7) of which are managed automatically by APSR.
I believe we've found the right balance between simplicity and power. Virtual Fields, and Field Descriptions, help both the novice user by making queries incredibly easy to build, and the expert user by allowing them to create much more complex queries while still automatically handling many of the trivial relationships.
If you'd like to try APS Reporter/SP, and the Query Builder, use the link on the right to request a free trial license, or if you have any queries(!) or comments just post them below.
Regards,
Brian
The Query Builder was perhaps the most challenging part of the application. Typically, Query Builders are confusing for new users, they can be daunting and often new users will be discouraged as soon as the Query Builder window opens. They have lots of tables floating around the window, with connections between them, strange symbols, and cryptic field names. For Expert users though, Query Builders are great, they open up so many options that would otherwise be unavailable, and we had to maintain that.
We elected to stick with a fairly traditional Query Builder window, but we introduced a powerful new system of Virtualisation that simplifies the structure of Queries. This means that many queries can now be built with just a single table, or perhaps two, while the system automatically filled-in the missing information. We also added meaningful descriptions to field names, so rather than just seeing CMPNT_SYS_IO_TYPE_NAME, the user also sees "Instrument I/O Type".
The Result?
Of course, if you'd like to add some more tables, that's fine too, it's still a fully functional Query Builder. For example, if we wanted to include some fields from the Component Function Type table, then we just add it to the Query and join in the traditional way.
For the SQL-geeks, this produces the following (for the non-geeks, you can ignore this bit, it doesn't really matter!):
Select
COMPONENT.CMPNT_NAME,
COMPONENT.CMPNT_FUNC_TYPE_NAME,
COMPONENT.CMPNT_SYS_IO_TYPE_NAME,
COMPONENT.CMPNT_LOC_NAME,
COMPONENT.CMPNT_MFR_NAME,
COMPONENT.CMPNT_MOD_NAME,
COMPONENT.CMPNT_SERV,
COMPONENT_FUNCTION_TYPE.CABLE_NUM,
COMPONENT_FUNCTION_TYPE.PANEL_NAME,
COMPONENT_FUNCTION_TYPE.SPEC_FORM_CNUM
From
COMPONENT
Inner Join
COMPONENT_FUNCTION_TYPE
On COMPONENT.CMPNT_FUNC_TYPE_ID = COMPONENT_FUNCTION_TYPE.CMPNT_FUNC_TYPE_ID
A simple SQL statement, which you could hand-edit if you chose to. Of course, this SQL statement wouldn't work in any other application (the Virtual Fields would cause errors), but APSR correctly interprets it and translates it into the SQL statement required by the database server. There are actually nine (9) different tables in the query above, seven (7) of which are managed automatically by APSR.
I believe we've found the right balance between simplicity and power. Virtual Fields, and Field Descriptions, help both the novice user by making queries incredibly easy to build, and the expert user by allowing them to create much more complex queries while still automatically handling many of the trivial relationships.
If you'd like to try APS Reporter/SP, and the Query Builder, use the link on the right to request a free trial license, or if you have any queries(!) or comments just post them below.
Regards,
Brian
Sunday, January 27, 2013
PipeRuns, Lines, and Regular Expressions
Many of the custom reports we develop perform some type of data validation, whether we're checking data delivered to clients, looking for data-entry errors, or preparing data for publishing. Validation usually involves multiple processes, but often the initial issue is to determine whether the data even conforms to the required format.
For this, Regular Expressions can be a really useful tool, but they're also a little cryptic and confusing. Regular Expressions have a variety of uses, but for data validation they let us define a format for data (text strings) and then to check our data for matches or errors.
Recently we were designing a report to validate the Item Tags of PipeRuns and of course the initial issue was determining whether the format of the Item Tag conformed to the project's standard. The correct format is as follows:
LX-100-789-GN12-BL1XY1-ISN
It's possible to write some complicated SQL using SubStrings to pull apart the text, but Regular Expressions are more concise, easier to modify, and easier to test.
Using APSR, we use a short Script to initialise a Regular Expression, and then test each data item against it. For example, to test the Line Number format above, we'd use the following Regular Expression:
^[A-Z]{2}-\d{2,3}-\d{3}-[A-Z]{2}\d{2}-BL\d{1}[A-Z ]{2}\d{1}(-[A-Z]{1,2})?$
That looks confusing, but breaking it down, it all makes sense:
^
Start of the String
[A-Z]{2}
Characters must be between A and Z, exactly 2 of them
\d{2,3}
Between 2 or 3 digits
\d{3}
Exactly 3 digits
[A-Z]{2}
Characters must be between A and Z, exactly 2 of them
\d{2}
Exactly 2 digits
BL
Literal text (the characters B & L)
\d{1}
Exactly 1 digit
[A-Z ]{2}
Characters must be between A and Z, exactly 2 of them
\d{1}
Exactly 1 digit
(-[A-Z]{1,3})?
Between 1 and 3 Characters from A-Z, but they're optional.
$
End of the String
In the first Validation phase we check the PipeRun ItemTag against the Regular Expression. For ItemTag's that fail this first test, there's not much more we can do, but if we get a match, then usually we'd move on to checking the individual components of the ItemTag (Nominal Diameter, Fluid Code, etc).
The Script below takes the "Lines" table created by the Query, adds a new Boolean column to indicate the result of the Regular Expression match, and then iterates through all of the entries in the Lines table (unique PipeRun ItemTags in this case).
 This Script actually checks two different Regular Expressions, checking each ItemTag against first one, and if it fails then checks the other. If either Regular Expression is a Match, then "FormatMatch" is set to True (otherwise False).
The remaining Validation checks are then implemented in the Grid window (the Regular Expression can also be implemented in the Grid window, but we chose to use a Script for performance reasons).
In the sample report, we construct a "Derived ItemTag" which is a Calculated Grid Field composed of the various data fields that make up the Item Tag, in the correct format. Ideally, the Derived Item Tag, and the actual Item Tag field will match, but if they don't then someone needs to check why.
 The Grid is filtered to only show PipeRuns with errors, and to highlight PipeRuns with invalid Item Tags in yellow, and mismatched Derived Item Tags in pink. Note that we could have configured the Grid to also compare the constituent parts of the Item Tag and highlight the specific sections in error. (apologies for the blurred text, but we can't show our Client's data).
If you'd like to use this report on your own SPPID system, or to modify it for your requirements, a copy of the final APSR report is available (note that you will need APS Reporter/SP installed).
By the way, if you're creating your own Regular Expressions, I'd recommend a copy of Expresso. It's a great tool for building regular expressions, and you can also provide test data to confirm you're finding the right errors.
Regards,
Brian
For this, Regular Expressions can be a really useful tool, but they're also a little cryptic and confusing. Regular Expressions have a variety of uses, but for data validation they let us define a format for data (text strings) and then to check our data for matches or errors.
Recently we were designing a report to validate the Item Tags of PipeRuns and of course the initial issue was determining whether the format of the Item Tag conformed to the project's standard. The correct format is as follows:
LX-100-789-GN12-BL1XY1-ISN
It's possible to write some complicated SQL using SubStrings to pull apart the text, but Regular Expressions are more concise, easier to modify, and easier to test.
Using APSR, we use a short Script to initialise a Regular Expression, and then test each data item against it. For example, to test the Line Number format above, we'd use the following Regular Expression:
^[A-Z]{2}-\d{2,3}-\d{3}-[A-Z]{2}\d{2}-BL\d{1}[A-Z ]{2}\d{1}(-[A-Z]{1,2})?$
That looks confusing, but breaking it down, it all makes sense:
^
Start of the String
[A-Z]{2}
Characters must be between A and Z, exactly 2 of them
\d{2,3}
Between 2 or 3 digits
\d{3}
Exactly 3 digits
[A-Z]{2}
Characters must be between A and Z, exactly 2 of them
\d{2}
Exactly 2 digits
BL
Literal text (the characters B & L)
\d{1}
Exactly 1 digit
[A-Z ]{2}
Characters must be between A and Z, exactly 2 of them
\d{1}
Exactly 1 digit
(-[A-Z]{1,3})?
Between 1 and 3 Characters from A-Z, but they're optional.
$
End of the String
In the first Validation phase we check the PipeRun ItemTag against the Regular Expression. For ItemTag's that fail this first test, there's not much more we can do, but if we get a match, then usually we'd move on to checking the individual components of the ItemTag (Nominal Diameter, Fluid Code, etc).
The Script below takes the "Lines" table created by the Query, adds a new Boolean column to indicate the result of the Regular Expression match, and then iterates through all of the entries in the Lines table (unique PipeRun ItemTags in this case).
The remaining Validation checks are then implemented in the Grid window (the Regular Expression can also be implemented in the Grid window, but we chose to use a Script for performance reasons).
In the sample report, we construct a "Derived ItemTag" which is a Calculated Grid Field composed of the various data fields that make up the Item Tag, in the correct format. Ideally, the Derived Item Tag, and the actual Item Tag field will match, but if they don't then someone needs to check why.
If you'd like to use this report on your own SPPID system, or to modify it for your requirements, a copy of the final APSR report is available (note that you will need APS Reporter/SP installed).
By the way, if you're creating your own Regular Expressions, I'd recommend a copy of Expresso. It's a great tool for building regular expressions, and you can also provide test data to confirm you're finding the right errors.
Regards,
Brian
Wednesday, January 23, 2013
First Post
Welcome to "Engineering Intelligence" where I'll probably talk about Engineering (occasionally), Data Management (mostly), Software Development (sometimes), Business (rarely), and some of it may even be Intelligent!
At APS we spend most of our time working with various Engineering Database systems such as Intergraph's SmartPlant Suite, providing consulting services for SPI, SPEL, SPPID, SP3D & SPF, and for the last few years we've been putting an unreasonable amount of time into our pet project, APS Reporter/SP (APSR).
 This has been an interesting journey into .NET (and Software Development in general) that has taken far longer than anyone expected, but we now have undoubtedly the best database reporting tool for engineering requirements. APSR lets us do things that just can't be done with other data management & reporting tools, we get to delve deep inside our databases mining for the information we know is in there, but is often hidden behind application front-ends and layers of database normalisation & optimisation.
In this Blog I'll be discussing some of the cool things we can do with APSR, some development related stuff about features for upcoming releases, info about the various databases we support, and some general Engineering Data Management issues. We're really enthusiastic about APSR and the software development team are proud of what we've achieved, we now want to help as many people as possible get the most from their databases.
Our initial plans were to develop a package that could handle complex reporting requirements, to automatically manage title blocks, to separate report design from document definitions, to support revisioning of documents, to enable revision comparisons, and to seamlessly support multiple project databases from the same system. These were all functions that we need in almost every report we issue, but no existing tool could handle them out of the box. Version 1 implemented most of the planned features, with support for MS-SQL and Oracle databases.
In Version 2.0 we added a new function that could revolutionise reporting for complex relational databases (and not just engineering databases). Virtualisation of the database schema allows us to hide the complexity of large database systems behind a simplified Virtual Model of the database, making reporting (and data extraction) incredibly easy. Currently supporting SPI, SPEL, SPPID & SPF, we plan to extend the Virtualisation to additional systems very soon. Words can't do justice to the power of Schema Virtualisation, you really need to see this in action to fully appreciate just how powerful it is. (Of course, we still support any other MS-SQL or Oracle database in a non-virtualised mode).
Version 3.0 added Sub-Reports to the Banded Reporting System in APSR, and begun laying the ground work for major new features to be added later. With Sub-Reports we can get much more creative with the page layout and solve problems that would be incredibly difficult otherwise (for example SPI Termination Reports with Left & Right hand connections are virtually impossible without Sub-Reports).
Now, in Version 4.0 we've added the most requested feature from clients, reporting from multiple databases. Reports can now combine data from more than one database, such as creating Cable Schedules by combining Cables from SPI & SPEL, or producing an Instrument Index from SPI with additional data from SPPID, or linking SPF data with other corporate databases for consolidated reports. We also threw in multi-query support, and a complete Scripting system (VB & C#).
This new release is the complete app we've been working toward for almost four years and we can finally do all those things we really want to, without hitting brick walls when the tool came up short. With the Virtualisation system we can generate powerful queries to extract data, Scripts can slice & dice the data any which way we need to, the Grid tool provides a simple tabular (think Excel) tool for formatting data, and the powerful Banded Report Designer allows us to produce pixel-perfect deliverable Reports.
Of course, it's not just Reports. We can extract data for users to run adhoc analysis, or export data to other systems, and even schedule reports with automatic email dispatch (great for regular daily or weekly reports).
If you'd like to learn more about APS Reporter/SP, you can check out the web site at APS Reporter/SP, or watch our demo videos at YouTube.
Regards,
Brian
At APS we spend most of our time working with various Engineering Database systems such as Intergraph's SmartPlant Suite, providing consulting services for SPI, SPEL, SPPID, SP3D & SPF, and for the last few years we've been putting an unreasonable amount of time into our pet project, APS Reporter/SP (APSR).
In this Blog I'll be discussing some of the cool things we can do with APSR, some development related stuff about features for upcoming releases, info about the various databases we support, and some general Engineering Data Management issues. We're really enthusiastic about APSR and the software development team are proud of what we've achieved, we now want to help as many people as possible get the most from their databases.
Our initial plans were to develop a package that could handle complex reporting requirements, to automatically manage title blocks, to separate report design from document definitions, to support revisioning of documents, to enable revision comparisons, and to seamlessly support multiple project databases from the same system. These were all functions that we need in almost every report we issue, but no existing tool could handle them out of the box. Version 1 implemented most of the planned features, with support for MS-SQL and Oracle databases.
In Version 2.0 we added a new function that could revolutionise reporting for complex relational databases (and not just engineering databases). Virtualisation of the database schema allows us to hide the complexity of large database systems behind a simplified Virtual Model of the database, making reporting (and data extraction) incredibly easy. Currently supporting SPI, SPEL, SPPID & SPF, we plan to extend the Virtualisation to additional systems very soon. Words can't do justice to the power of Schema Virtualisation, you really need to see this in action to fully appreciate just how powerful it is. (Of course, we still support any other MS-SQL or Oracle database in a non-virtualised mode).
Version 3.0 added Sub-Reports to the Banded Reporting System in APSR, and begun laying the ground work for major new features to be added later. With Sub-Reports we can get much more creative with the page layout and solve problems that would be incredibly difficult otherwise (for example SPI Termination Reports with Left & Right hand connections are virtually impossible without Sub-Reports).
Now, in Version 4.0 we've added the most requested feature from clients, reporting from multiple databases. Reports can now combine data from more than one database, such as creating Cable Schedules by combining Cables from SPI & SPEL, or producing an Instrument Index from SPI with additional data from SPPID, or linking SPF data with other corporate databases for consolidated reports. We also threw in multi-query support, and a complete Scripting system (VB & C#).
This new release is the complete app we've been working toward for almost four years and we can finally do all those things we really want to, without hitting brick walls when the tool came up short. With the Virtualisation system we can generate powerful queries to extract data, Scripts can slice & dice the data any which way we need to, the Grid tool provides a simple tabular (think Excel) tool for formatting data, and the powerful Banded Report Designer allows us to produce pixel-perfect deliverable Reports.
Of course, it's not just Reports. We can extract data for users to run adhoc analysis, or export data to other systems, and even schedule reports with automatic email dispatch (great for regular daily or weekly reports).
If you'd like to learn more about APS Reporter/SP, you can check out the web site at APS Reporter/SP, or watch our demo videos at YouTube.
Regards,
Brian
Subscribe to:
Comments (Atom)