Showing posts with label SPI. Show all posts

Wednesday, April 16, 2014

Simple SPI Query

APS Reporter makes it very easy to extract data from an SPI database, whether you want to dump data to an Excel file for import to another system, or produce a fully formatted, pixel-perfect document. In this post I wanted to show just how quick and easy it is to create a Query and get the data out, with only a minimal knowledge of the SPI database.

For demonstration purposes, lets assume we want to get a list of Instruments with some basic data from the Index (I/O Type, Location, Instrument Type), plus details of the I/O Channel for the Instrument (Panel, I/O Card, Channel). Perhaps we need to provide this data to our DCS Supplier, for them to import into their own applications.

Also, lets for argument sake, assume we also want to include the Specification Sheet number for each Instrument, just for demonstration purposes.

This means we're looking for data from the Index, Wiring and Specification modules of SPI and typically you wouldn't be able to produce a report like this in the SPI Browser module. You could perhaps use Infomaker, MS-Access, or a similar query tool, but these would require a deeper understanding of the SPI database and the resulting queries would be quite complex.

APS Reporter/SP makes this process a lot easier.
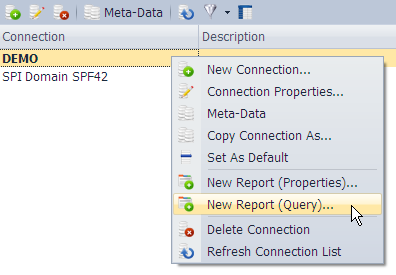

Firstly, we start with a New Report for our SPI Connection
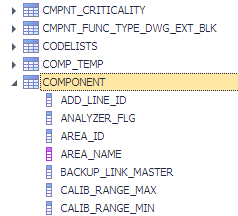

Once the Query Builder window opens, drill down the table tree to find the Component table, this is the main Instrument table in SPI.
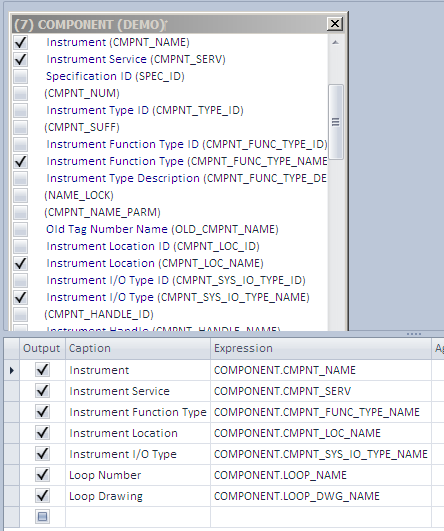

Double-click the Component table to add it to the Query Drawing pane, and select the fields we'd like to include in our query. I've selected the Instrument, Service, Function Type, Location, I/O Type, Loop Number and Loop Drawing fields.

Notice that in APSR we can select all of these fields directly from the Component table. In reality, in the database they are actually stored as part of five other tables, but APSR understands the database structure and resolves these fields for us.

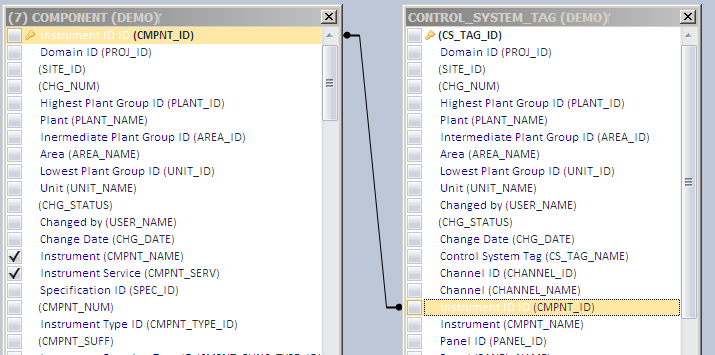
Next, we need to add the Control System Tag table. Double-click this to add it to the drawing pane.


We need to join the Control System Tag table to the Component table, which we do by dragging the Instrument ID (CMPNT_ID) field from one table and dropping it on the corresponding field in the other table.


We then can select the fields we need from the Control System Tag table. I've selected the Control System Tag Name, Panel, Strip and Channel names.

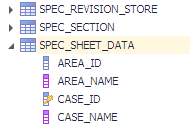
To get the Specification Sheet Number, we also need to add the Spec Sheet Data table. Again, double-click this to add it to the query drawing pane.
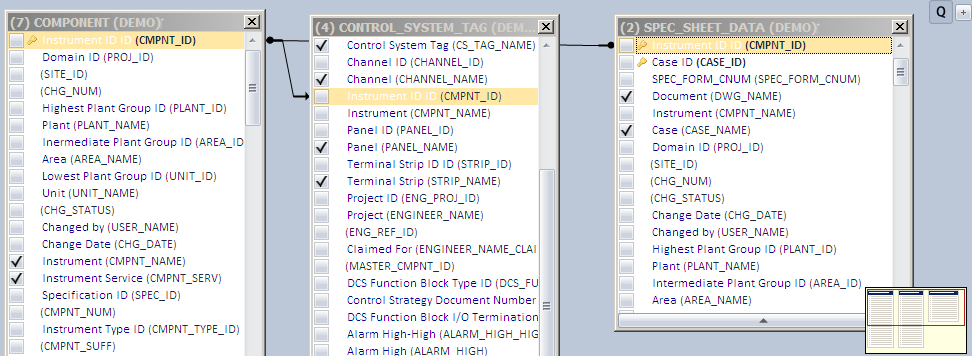
Again, we need to join the new table by dragging the Instrument ID (CMPNT_ID) field from the Component table to the Spec Sheet Data table. We can also select the Specification Sheet Number field at this time.
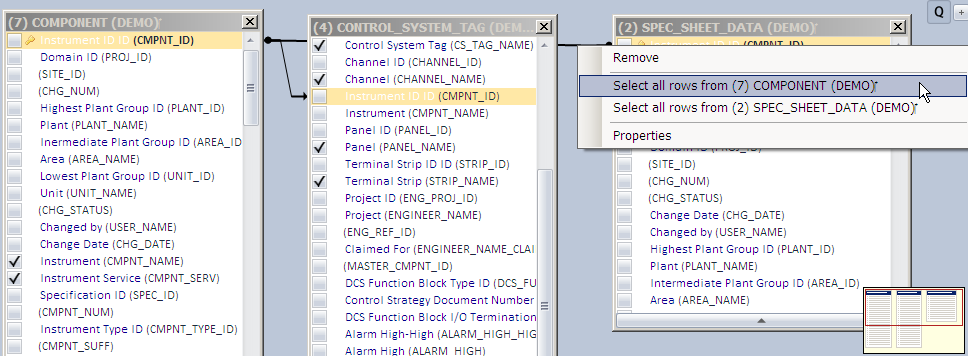
We need to make one more change to our query. By default, our results will ONLY include tags that have BOTH an I/O Channel assigned PLUS a Spec Sheet Number.

In this case, we actually want to include ALL Instruments in our results, so we need to change the Joins between the tables as shown in the image to the right (right-click on the Join line to see the menu).


That's It!
Switch to the Results Grid to see the data.
In addition to the data, the results grid also has correct title for all the columns.

If this query were written in some other tool (Infomaker, MS-Access, etc), it would have required a minimum of twelve tables, and upwards of 15 joins. Also, the fields would be labelled with the standard database names and would need to be modified for our end-users.

Our query required a total of three tables and two simple joins. APSR was able to resolve the other tables and fields as required. Of course, if you're an SQL Guru, don't worry, the APSR Query Builder can be used like any other SQL Query tool, and the Virtual Tables & Fields can be mixed and matched with standard objects. In short, SQL Virtualisation adds a whole lot of power, without taking anything away.

If you'd like to try APSR for yourself, download the Free Version from the link to the right (the Free Version is not a time-limited trial, it will not expire, and can be used in production systems if required).


Regards,

Brian Raynor.
View Brian Raynor's profile on LinkedIn

Saturday, April 5, 2014

Useful Tool for Developers and Administrators

In this post I want to briefly discuss how Developers and Administrators can use the new Free License for APSR to get easier access to SmartPlant databases.

When you're working with COTS (commercial-off-the-shelf) software, sometimes you want to go beyond what the app will let you do. Sometimes you want to look under hood and work out what it's doing, or maybe pull some data out to do something clever with it. If you're a Developer or a Power-Admin, sometimes you need more than the tools the vendor gave you.

For example, the SmartPlant apps are all complex, powerful tools. They provide a wealth of functions, and an experienced user can do amazing things very quickly, but occasionally you want something that the developer just hasn't provided. Perhaps you want to use it in a way that wasn't intended, maybe you want to integrate with some other 3rd party application, or you just want to see how it works under the hood.

Wednesday, March 13, 2013

Instrument Data from SPI and SPPID

Various techniques are available to connect the SPI & SPPID databases (for comparison or reporting), each with it's own advantages and disadvantages.

Of course, a fully integrated SPE environment is the Rolls-Royce option. It permits intelligent, automated exchange of data in a structured environment with fine control over each step. Of course it also imposes a significant overhead, requires careful implementation, and requires an experienced developer to make any customisations.

Various other techniques are available to connect the two systems, such as using the direct SPI to SPPID tools provided in the apps, exporting reports from each system and linking them, or importing SPPID data directly into SPI.

The latest release of APS Reporter/SP (Version 4.0) introduced a new option for linking databases. Not just SPI and SPPID, but any combination of MS-SQL and Oracle databases can be linked for comparison, data extraction or reports. Potentially, data could be combined from SPI, SPEL, SPPID, SPF plus other engineering or corporate databases into a single report.

Monday, March 11, 2013

Instruments & Junction Box Connections

One of the really cool features of APS Reporter/SP is the Query Builder.

If you've worked with almost any database tools, you've seen graphical query builders. They help build SQL statements by dragging & dropping tables, creating joining, selecting fields, etc. Mostly they work much the same, with just some minor graphical changes, and usually they are great for simple queries, but have difficulty with complex queries. When it comes to writing complex queries, with sub-queries, nested unions, etc, it's back to directly coding SQL statements.

Novice users also generally have problems with Query Builders. Yes, they're graphical, and they are supposed to make it easy to create SQL statements, but they still use arcane Table & Field names, and the user still needs to understand how the database fits together. Despite being a "graphical" tool, they're still a barrier to new users getting up to speed.

For APSR, we have implemented a Query Builder that can handle almost any SQL statement, no matter how complex, all graphically. The weird field names now have clear descriptions of each field, and Virtual Tables & Fields simplify the database structure. Suddenly complex queries aren't so complex any more!

Here's a typical example. We wanted to create a simple Instrument Index Report for SPI, with the usual fields (Tag, Service, Manufacturer, Model, I/O Type, etc) plus we also wanted to include the Junction Box that the Instrument is connected to (ie where the field device is wired to). Simple enough requirement, but the Query is non-trivial.

The first step was to select all of the simple fields from the Component table in SPI:
Fortunately, the Virtual Fields in APSR make this really easy. Almost all of the fields we want are included as Virtual Fields in the Component table, so we just need to pick them. There's no need to join to the various supporting tables (like Function Types, I/O Types, Equipment, Manufacturer, Model, etc).

The only complicated field in this Report will be the Junction Box that the field devices connect to. To identify the correct Junction Box, the Query uses a sub-query with Wire Group (signal) information to find, for each signal, the lowest signal sequence number in a Junction Box. Then a second sub-query is used to find the particular Junction Box that contains that signal sequence number.

In APSR, sub-queries are defined as "Derived Tables". Creating a Derived Table produces a new work-space for us to build our sub-query.

The first sub-query actually finds the lowest wire GROUP_SEQ number for each WIRE_GROUP_ID, for wires that are connected to Junction Boxes (CATEGORY_SEQ = 6).
Then, we use the another Derived Table to use the minimum GROUP_SEQ from above to identify the correct Panel (Junction Box).
Our first Derived Table appears in the middle, with only the two selected fields showing. This second Derived Table has two outputs, the CMPNT_ID to identify the field device, and the Panel Name (which conveniently uses another Virtual Field to simplify our query). This Derived Table appears in our Main query, where we join to the Component table, and select the Panel name (using an Outer Join, as not all Instruments are connected to Junction Boxes).
Switching to the Query Results, we get:
The final SQL Query Statement is shown below, although fortunately we don't ever need to actually work with this. You could copy-and-paste it into your own APSR system, although the full report is included as a Sample Report in the installation package. (Note that this Query will not work in other tools as it uses APSR Virtual Fields that are not supported by other applications)

Select
                    COMPONENT.CMPNT_NAME,
                    COMPONENT.CMPNT_SERV,
                    COMPONENT.CMPNT_FUNC_TYPE_DESC,
                    COMPONENT.CMPNT_FUNC_TYPE_NAME,
                    COMPONENT.PLANT_NAME,
                    COMPONENT.AREA_NAME,
                    COMPONENT.UNIT_NAME,
                    COMPONENT.LOOP_NAME,
                    COMPONENT.CMPNT_MOD_NAME,
                    COMPONENT.CMPNT_MFR_NAME,
                    JUNCTION_BOX.PANEL_NAME As FIRST_JB,
                    COMPONENT.LOOP_DWG_NAME,
                    COMPONENT.PID_DWG_NAME
From
                    COMPONENT
                    Left Join
                    (Select WIRE_GROUP.CMPNT_ID,
                      WIRE_TERMINAL.PANEL_NAME
                    From WIRE_GROUP
                      Inner Join WIRE_TERMINAL On WIRE_GROUP.WIRE_GROUP_ID = WIRE_TERMINAL.WIRE_GROUP_ID
                      Inner Join (Select Min(WIRE_TERMINAL.GROUP_SEQ) As MIN_GROUP_SEQ,
                        WIRE_TERMINAL.WIRE_GROUP_ID
                      From WIRE_TERMINAL
                        Inner Join PANEL On WIRE_TERMINAL.PANEL_ID = PANEL.PANEL_ID
                      Group By WIRE_TERMINAL.WIRE_GROUP_ID,
                        PANEL.PANEL_CATEGORY_SEQ
                      Having PANEL.PANEL_CATEGORY_SEQ = 6) FIRST_JB_CONNECT 
                            On WIRE_GROUP.WIRE_GROUP_ID = FIRST_JB_CONNECT.WIRE_GROUP_ID 
                            And WIRE_TERMINAL.GROUP_SEQ = FIRST_JB_CONNECT.MIN_GROUP_SEQ
                    Where WIRE_TERMINAL.WIRE_GRP_LEVEL = 1) JUNCTION_BOX
                            On COMPONENT.CMPNT_ID = JUNCTION_BOX.CMPNT_ID
Where
                    COMPONENT.CMPNT_ID <> 0 And
                    COMPONENT.PLANT_ID <> 0
Order By
                    COMPONENT.LOOP_NAME,
                    COMPONENT.CMPNT_NAME

Sub-queries are an incredibly powerful tool for expanding your Reports, and with the APSR Query Builder creating Sub-queries (or Derived Tables) is as simple as almost any other query.

If you'd like to see some other sample queries and reports for SPI, check the relevant Wiki page. More information is also available from the various links to the right.

If you have any queries (pun?) or comments, feel free to add them below.

Regards,

Brian Raynor.
View Brian Raynor's profile on LinkedIn

Saturday, March 2, 2013

SPF as a Source of Data

I'll apologise in advance, this is going to turn into a long post with lots of text and some obscure concepts, but I promise it will be worthwhile. I'm already planning for this to be the first in a trilogy covering APSR and the SPF database (sort of an APSR: A New Hope), with this one setting the stage and the next couple diving deeper into the technical stuff. If after reading this you have any comments or would like any further information, please feel free to use the comment box below, or contact me through one of links to the right.


When we're designing reports we work with a variety of databases and mostly it's simple enough to connect to the database and identify the major tables, find the fields we need for a report, and build a query to extract the data. Of course, some databases are more complex (eg SPEL, SPPID) and even relatively simple reports require a good understanding of the underlying database, but it can be done without too much trouble.

Most databases are highly normalised and are optimised for performance. This usually means they have many tables, in a highly structured form, where each table has a unique key (id) field. This allows the database engine (Oracle or MS-SQL Server) to find the most efficient way to retrieve data when requested by the application.

Unfortunately, the trade-off for us is that a highly normalised and optimised database is usually more complex to produce reports. The required data fields are spread across a lot of tables, and the designer needs to understand how they're all related.

SPF Is Different

Then there are databases like SPF. If you've ever looked at the SPF database, at first glance it doesn't seem too complicated as there are just a handful of tables, however the complexity of the SPF database lies not in the number or structure of the tables but in how the data is stored in the tables. A single application Object is not stored as a row in a table, but is spread across many rows and often many tables. This design is not optimised for performance, instead it is designed for flexibility, allowing the SPF Developer to add new Classes, Interfaces and Relations without modifying the underlying database structure. This allows SPF to support a catalog of 2000+ Classes, with 70,000+ Properties, with less than 20 database tables.

For the Report Designer, however, this structure is a major problem. Extracting meaningful reports directly from the SPF Database is incredibly difficult, and those who have tried do not always succeed. Just working out how the data is stored is a challenge, but then creating SQL Queries to piece together all of the required data requires specialist skills. It is possible to manually write queries that provide simple lists of data, such as a document list, or a tag list, but creating queries that join the data together in meaningful ways is almost impossible.

For example, if you were working with a conventional relational database, and you wanted to get a list of documents that were associated with transmittals that are overdue, it typically wouldn't be very complex (probably two or three major tables, plus some supporting tables). A similar Query from the SPF database would be enormously complex, and even if it worked, just validating the query would be difficult (how many people could even understand it!).

This is one of the trade-off's made by the Intergraph developers in implementing SPF, it would be flexible, but working with the database would be complex. SPF users cannot use conventional database tools, like Toad or Crystal Reports, to extract data or create reports, they are almost cut-off from their data and must use the SPF software itself for all queries and reports. Standard SQL queries became impractical.

Simplifying Databases

APS Reporter/SP was designed to simplify the creating of Reports, by making it easier to extract the data (query), easy to produce either simple tabular reports, or complexly formatted reports, and easier to keep revisions, add title blocks, etc.

The Queries are simplified by using a technique known as Schema Virtualisation, which uses a Model of the database that is optimised for Reports. The user doesn't work directly with the underlying database, they work with a Virtual Model that appears to be a standard relational database with Tables and Fields that are easy to understand (but not necessarily optimised for the database server).

The first Virtualiser we developed was for SmartPlant Instrumentation. SPI has a database that is relatively large (300+ tables), but is not overly complex. It's not a very difficult database to use for reports, but often even a simple report (such as an Instrument Index) can require 10 or more tables, and complex queries could include many more. Using the SPI Virtual Model the same query can include just 1 table, and complex queries often just 3 or 4.

SPI Queries using the native database, and the Virtual Model
The SPI Virtualiser was a great success. It creates a model of the SPI database that is very similar to the original, so users who have mastered the SPI database structure can use that knowledge, but it simplifies all of the common relationships. Novice users can easily generate simple queries , and just as importantly, expert users can leverage the Virtual Model to create complex queries much more easily. The SPPID & SPEL Virtualisers were similarly successful.

But what about SPF?

SPF was challenging. Could we produce a Virtual Model that made it easy to create queries, with no knowledge of the SPF database structure?

Initially, we tackled SPF 3.8 (Business Objects), and it worked beautifully. Users could build SQL Queries, working with the various Business Objects, while completely ignoring the cryptic table names and field names of the native database.

The real challenge was SPF 4.x. The Virtual Model had to fully support the ClassDef's, InterfaceDef's and RelDef's of the Schema model, allowing Report Designers to write Queries using the Objects they were familiar with. It also had to adapt to each client's database, including all of the custom schema objects defined in each system, and for the custom objects to work seamlessly with the out-of-the-box objects.

SPF Query with DocMaster & DocRevision
The SPF 4.x Virtual Model demonstrates the power of Schema Virtualisation. The native SPF database is completely hidden from the user, while Virtual Tables representing of Classes, Interfaces and Relations are available to build SQL Queries. For example, the query above joins the SPFDesignDocMaster and SPFDesignDocRevision Virtual tables, using the RelDef SPFDocumentRevisions.

It's now possible to write quick and easy adhoc SQL queries for the SPF database using standard SQL syntax. Complex queries can be written without any specialist knowledge of the SPF database structure, and Reports can be produced in a fraction of the time usually required.

In the next post I'll look at the process of writing queries for SPF with some tips and tricks to make life even easier.

If you have any comments, please feel free to use the comment box below. If you would like any further information, a free trial license, or a demonstration of APS Reporter/SP, please feel free to use the links to the right.

Thursday, February 14, 2013

Cable Schedules

This is a brief post covering a feature of APSR that was introduced in Version 3.0 but is not often used, despite it being a really powerful tool for controlling page layouts in the Report Designer.

Sub-reports are one of those features that will either make your eyes light up, or will draw a blank "Huh?". They're great when you need to design a complex report, and there are some designs that just can't be done without sub-reports, but if you've never needed them, then you've probably never even tried them.

For the experienced Report Designer, Sub-reports provide the ultimate in fine-grained control over your report layout, and in APSR we have perhaps the easiest sub-reports of any reporting application. When the report designer is open, all report sections and sub-reports are shown as tabs across the top of the window, and switching between the Parent report and the Child (sub) report is as easy as switching tabs.

The new report "Cable Schedule with Routing Sub-report" is a great example.
Cable Schedule with Routing Sub-report
Each Report Section can be either a full-page Section that prints on separate pages in the final report, or a Sub-Report Section that printed embedded in another page. This report contains six separate sections, the first three of which are separate printable sections which appear full-page, and the last three are sub-reports which appear embedded on the Cable Schedule page.

Each Report Section has a Sequence Number that determines the order in which they appear in the final Report (a value of zero (0) indicates it's a sub-report only). For example, the Summary Page is a simple list of the Cable Types included in the main Cable Schedule, with the total length of each Type shown. This is the second section to print, as set in the Properties box.
Section Display Name and Sequence Number (print order)
The main section of the report (Cable Schedule) includes two sub-reports, one for the Cable Route information, and another as a Title Block. Cable Routes show the various Cable Ladder sections or Nodes that the Cable passes through, and there can be anywhere from zero (0) to dozens of Cable Route items for each Cable. We want them to appear in a compact area of the detail section of each Cable, in the Routing column.
Routing Sub-report Section embedded in the Parent Report Section
Finally, the Filter String is used to link the Parent and Child Reports. In this case, it filters the sub-report (with the route data) to only show route information for the Cable currently appearing in the Parent report.
Filter String linking the Parent & Child Report Sections
The Title Block sub-report appears in the Page Footer of the main Cable Schedule, and in-turn contains another sub-report for Revisions (ie nested sub-reports!) 

You can check-out the full report by downloading a trial package. We have also included an SPI Wiring Report "Terminal Strip with Wiring Connections" which shows the wire connections on each side of a Terminal Strip. For each terminal, a sub-report is used on the Left and Right hand sides which nicely handles situations were 2 or more wires are connected to the same terminals.

Saturday, February 2, 2013

Alarm & Trip Schedules

This week I was working on an Alarm & Trip Schedule for a client (hi Terri) and it occurred to me that this is a report that is required by almost every project, but is always a little complicated to produce.

Projects often require an Alarm & Trip Schedule to be produced from SPI, and it's often a frustrating process to extract the required data. The required fields appear in the Instrument Index module, the Process Data module, and the Wiring module, and no Browser conveniently combines everything into a single View. In fact, as a general rule, SPI doesn't provide many Browsers that mix data between modules.

Fortunately, it's actually quite simple to create an Alarm & Trip Schedule with APSR. The Query is relatively easy, making use of Virtual Fields and a nested Union, and of course the Grid or Designer make it simple to produce a deliverable report.

Typically an Alarm & Trip Schedule is a list of Instruments (usually Analog Inputs) with some basic tag data, the range of the device and/or DCS/PLC input, the Alarm & Trip Set-points (as defined by the Process Engineers usually) and the Set-points configured in the DCS/PLC. There may be other information, such as the I/O Card details, the Control System Tag & Description, etc.

The primary fields are found in the COMPONENT table, from which we select the core Instrument fields (Tag, Service, I/O Type) plus some range fields if required (Instrument Range, Calibrated Range and/or DCS Range).
Unfortunately, the Alarm & Trip Set-points are not in the Instrument Index, they're in the SPI Process Data module (a design decision that has caused a lot of frustration for many many projects). This creates two problems, one that the Alarm & Trip Set-points cannot be included in any Browsers in the Instrument Index module, and that it is necessary to create a Process Data entry for an Instrument before the Set-points can be entered. 

Often, to avoid these problems, projects will choose to use UDF's for alarms. This is a very practical solution, although it can cause confusion on projects where both the UDF's and the Process Data fields are used. 

The Process Data module has another complication, the Alarms & Trip Set-points are not stored in a single table, they're in the FLOW, LEVEL_INSTRUMENT , PRESSURE, and TEMPERATURE tables (depending on the Process Function Type of the Instrument). We need to use a UNION to combine the results from each of these tables in APSR, first by creating a Derived Table (sub-query) to hold the Union
In the Derived Table tab, we start with the FLOW table, and select the various Alarm & Trip Set-points and related fields:
Then create the Union by clicking the + next to the Q in the upper right corner of the window, this will open a new blank query pane for the next part of the Union. Add the LEVEL_INSTRUMENT table and select the corresponding fields here:
Repeat the process by adding new Union sections, adding the PRESSURE and TEMPERATURE tables, and selecting the corresponding fields. When we return to the Main tab, we now have a sub-query providing the combined Alarm & Trip Set-points from all of the Process Data tables:
(Note that the field descriptions are based on the first table in the Union)
The other place Alarm data is entered in SPI is as part of the Control System Tags associated with Instruments. By adding the CONTROL_SYSTEM_TAG table to our query we can extract the Control System Tag Name, Description, Calibration Range, Alarm Settings, plus other DCS and Wiring data as required.
In the end it's a relatively simple query. 

The results are shown below (click to enlarge).
I've used the APSR Grid to display the results. This makes it very easy to layout a simple report of rows & columns, and also is ideal if you need to export the final report to Excel. You could also use the Report Designer if you need a pixel-perfect fully formatted report.

You can download
That's the basic report, but of course it can be modified to the requirements of any particular project. Also, the Grid Layout I've developed is designed for exporting to Excel and issuing as a document, but if a data extract is required for export to the DCS programmers (for example), that is just as easy.

Let me know your thoughts. Do you have any specific requirements for an Alarm & Trip Schedule? 

Regards,

Brian.
View Brian Raynor's profile on LinkedIn

Wednesday, January 30, 2013

Simple Instrument Index Query

When we sat down to build our own reporting tool for engineering databases, we really wanted the best of all possible worlds (doesn't everyone!). We wanted something that was easy to use, that novices could learn without trouble, but something that experienced users wouldn't feel constrained by. The ease of use should work with the user, making complex tasks simple, not dumb it down to the point where it couldn't do anything but the most basic task.

The Query Builder was perhaps the most challenging part of the application. Typically, Query Builders are confusing for new users, they can be daunting and often new users will be discouraged as soon as the Query Builder window opens. They have lots of tables floating around the window, with connections between them, strange symbols, and cryptic field names. For Expert users though, Query Builders are great, they open up so many options that would otherwise be unavailable, and we had to maintain that.

When it came to the Query Builder for APSR, should we go with the traditional approach, or should we try something different. Almost everything "different" we've ever seen has meant "basic", where the user has a limited range of options, sometimes in some overly graphical window with lots of pretty pictures. Graphics are great, but they shouldn't actually confuse the user, and they shouldn't come at the expense of power!

We elected to stick with a fairly traditional Query Builder window, but we introduced a powerful new system of Virtualisation that simplifies the structure of Queries. This means that many queries can now be built with just a single table, or perhaps two, while the system automatically filled-in the missing information. We also added meaningful descriptions to field names, so rather than just seeing CMPNT_SYS_IO_TYPE_NAME, the user also sees "Instrument I/O Type".

The Result?
If you're an SPI user, you'll find building a Query is not very different to defining a Browser View. Simply select the fields you want, and the system does the rest. This one table is all that's needed for a simple Instrument Index report.

Of course, if you'd like to add some more tables, that's fine too, it's still a fully functional Query Builder. For example, if we wanted to include some fields from the Component Function Type table, then we just add it to the Query and join in the traditional way.
Here we've added the second table, and then used Virtual Fields to provide the default Cable Name, Panel Name and Specification Sheet Number for each Instrument Type. (Click the image to enlarge).

For the SQL-geeks, this produces the following (for the non-geeks, you can ignore this bit, it doesn't really matter!):

Select
                    COMPONENT.CMPNT_NAME,
                    COMPONENT.CMPNT_FUNC_TYPE_NAME,
                    COMPONENT.CMPNT_SYS_IO_TYPE_NAME,
                    COMPONENT.CMPNT_LOC_NAME,
                    COMPONENT.CMPNT_MFR_NAME,
                    COMPONENT.CMPNT_MOD_NAME,
                    COMPONENT.CMPNT_SERV,
                    COMPONENT_FUNCTION_TYPE.CABLE_NUM,
                    COMPONENT_FUNCTION_TYPE.PANEL_NAME,
                    COMPONENT_FUNCTION_TYPE.SPEC_FORM_CNUM
From
                    COMPONENT
                    Inner Join
                    COMPONENT_FUNCTION_TYPE
                    On COMPONENT.CMPNT_FUNC_TYPE_ID = COMPONENT_FUNCTION_TYPE.CMPNT_FUNC_TYPE_ID

A simple SQL statement, which you could hand-edit if you chose to. Of course, this SQL statement wouldn't work in any other application (the Virtual Fields would cause errors), but APSR correctly interprets it and translates it into the SQL statement required by the database server. There are actually nine (9) different tables in the query above, seven (7) of which are managed automatically by APSR.

I believe we've found the right balance between simplicity and power. Virtual Fields, and Field Descriptions, help both the novice user by making queries incredibly easy to build, and the expert user by allowing them to create much more complex queries while still automatically handling many of the trivial relationships.

If you'd like to try APS Reporter/SP, and the Query Builder, use the link on the right to request a free trial license, or if you have any queries(!) or comments just post them below.

Regards,

Brian
View Brian Raynor's profile on LinkedIn


UA-38428324-2